Bandwidth vs Latency vs Throughput: Differences, Measurement, and Troubleshooting Network Performance
Evergreen explanation of bandwidth, latency/RTT, jitter, and throughput with measurement tools, application impact, misconceptions, and a troubleshooting checklist to identify network bottlenecks.
Drake Nguyen
Founder · System Architect
Introduction — Why bandwidth vs latency vs throughput matters
Bandwidth vs latency vs throughput describes three core network performance metrics that explain why a connection can test “fast” yet feel sluggish in real use. Understanding the difference improves speed test interpretation, helps with bottleneck identification, and lets you choose fixes based on application sensitivity (for example, VoIP versus backups). This guide breaks down the concepts in plain English, shows how to measure them, and provides a practical troubleshooting checklist.
Bandwidth vs latency vs throughput — Definitions and key differences
Although they’re related, bandwidth, latency, and throughput describe different parts of network behavior. The network speed metrics difference is the fastest way to locate what’s limiting performance: capacity, delay, or end-to-end delivery efficiency.
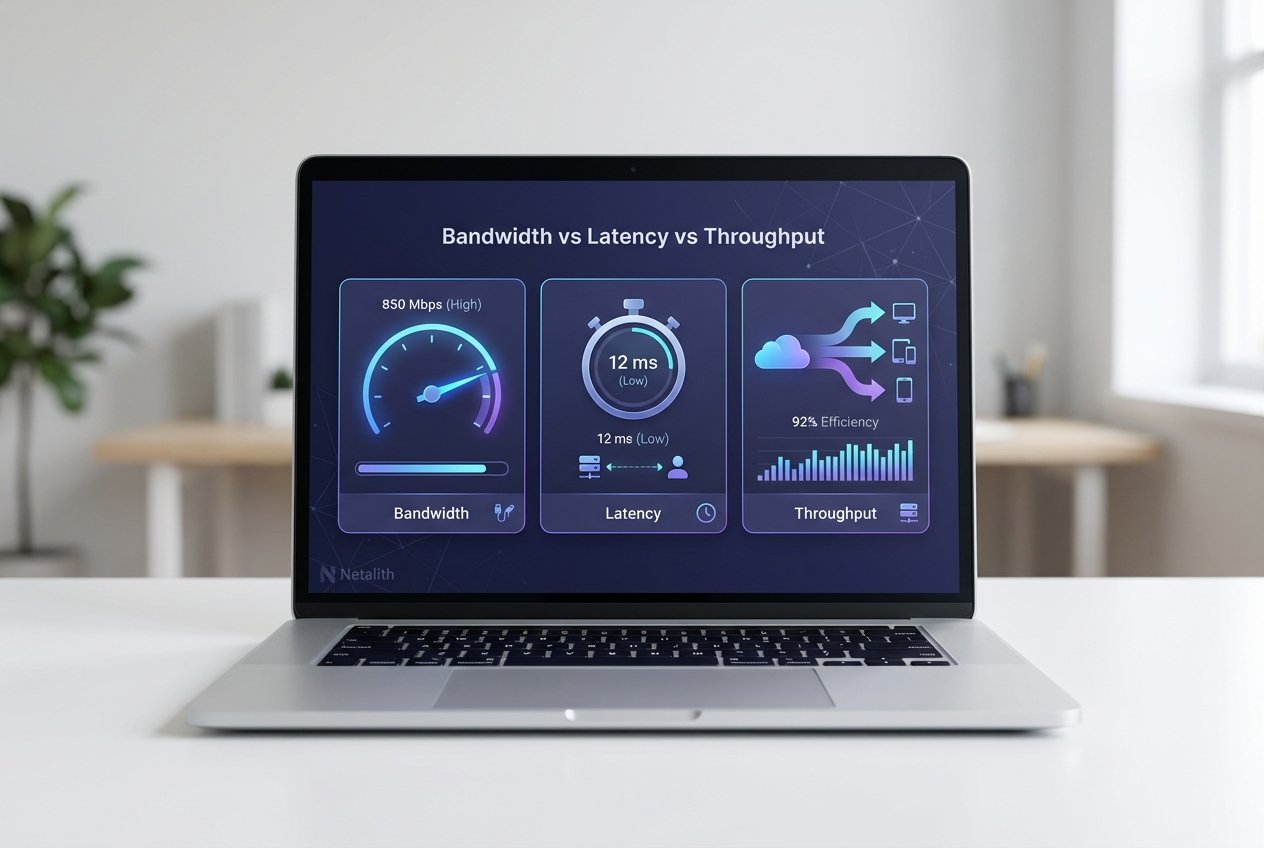
- Bandwidth: the maximum data rate a link can carry (capacity).
- Latency: the delay for a packet to travel end to end (responsiveness), often measured as RTT.
- Throughput: the actual, achieved data rate during real traffic (what users feel during transfers).
In practice, your user experience is usually governed by throughput and latency/jitter, not bandwidth alone.
Bandwidth: What it is, units, and examples
Bandwidth is the theoretical capacity of a network link, commonly shown in bps, Mbps, or Gbps. It’s a foundational network speed metric for bulk data movement—uploads, backups, replication, and large downloads.
Example: a 1 Gbps link describes potential capacity, but real results can be lower due to protocol overhead, shared medium contention (especially Wi‑Fi), and concurrent users. This is one reason why high bandwidth can still feel slow when the bottleneck is elsewhere.
Latency: What it is, RTT, jitter, and why it matters
Latency is the time delay between sending data and receiving a response. The most common measurement is round-trip time (RTT), reported in milliseconds. Low latency is critical for interactive workloads such as SSH, gaming, and video calls.
What is jitter in networking? Jitter is the variation in latency over time. Even with acceptable average RTT, high jitter can cause choppy audio/video and inconsistent gameplay. Packet loss makes latency feel worse because retransmissions add delay and reduce throughput.
Throughput: Real-world throughput vs theoretical bandwidth
Throughput is the measured rate of successful data delivery. It can fall below bandwidth due to congestion, endpoint limits (CPU/disk), protocol behavior (TCP windowing), QoS policies, or packet loss. In performance metrics networking, throughput is often the closest single number to “how fast it feels” for downloads and transfers.
For speed test interpretation, remember that most speed tests report end-to-end throughput to a specific server, not the maximum bandwidth of every hop in your path.
How these metrics affect applications (video, VoIP, gaming, backups
Different apps respond to different constraints, so prioritizing the right metric depends on application sensitivity:
- Video streaming: needs steady throughput; buffering can hide moderate latency.
- VoIP/video conferencing: needs low latency, low jitter, and low packet loss; throughput demands are usually modest.
- Online gaming: highly sensitive to latency and jitter; bandwidth needs are relatively small.
- Backups/large transfers: depend on throughput and available bandwidth; latency usually matters less.
QoS can protect real-time traffic by prioritizing voice/video packets ahead of bulk transfers, improving perceived performance without increasing bandwidth.
How to measure bandwidth, latency, and throughput (tools & interpretation
To measure these network speed metrics reliably, use multiple tests and compare results over time. One off tests can miss transient congestion, jitter spikes, or intermittent packet loss—common causes of user complaints.
Tools & commands: iperf, ping, traceroute, speedtest
Common tools for network performance metrics explained:
- ping — checks RTT and packet loss (quick latency health check).
- traceroute/tracert — reveals the path and per-hop delays, useful for bottleneck identification.
- iperf3 — measures TCP/UDP throughput between two controlled endpoints (isolates link and host constraints).
- speedtest services — estimate end-to-end throughput to a public server (good for ISP comparison).
ping -c 10 example.com
# Review average RTT and packet loss

traceroute example.com
# Look for the hop where delay increases significantly

iperf3 -s  # server
iperf3 -c server_ip  # client (measures throughput)
For repeatable baselines, record average/95th percentile RTT, jitter range (when available), packet loss percentage, and sustained throughput. Compare throughput to provisioned bandwidth to determine if the constraint is local (Wi‑Fi/router), upstream (ISP/cloud), or the application endpoint.
Common misconceptions — why high bandwidth can still feel slow
Why high bandwidth can still feel slow usually comes down to delay, loss, or per-flow limitations rather than a lack of capacity:
- High latency or jitter: interactive apps feel sluggish even when throughput is high.
- Packet loss: forces retransmissions, reducing throughput and increasing apparent RTT.
- TCP ramp-up/windowing: a single connection may not fully utilize bandwidth on high-RTT paths.
- Local bottlenecks: congested Wi‑Fi, router CPU limits, bad cables, or misconfigured switch ports.
- Application/server constraints: disk I/O, encryption overhead, rate limiting, or overloaded endpoints.
Accurate speed test interpretation means checking whether the symptom is “slow to start” (latency/jitter) or “slow to finish” (throughput/capacity).
Troubleshooting checklist: identify bottlenecks and fixes
- Collect baselines: measure RTT, jitter (if available), packet loss, and throughput (ping, traceroute, iperf3).
- Validate link speeds: confirm NIC negotiation, switch port speed/duplex, and cable quality.
- Eliminate Wi‑Fi variables: test wired to separate wireless interference and congestion.
- Check QoS: ensure latency-sensitive apps (VoIP/video) are prioritized where appropriate.
- Locate the hop: use traceroute to spot where latency jumps, then investigate routing vs switching paths and upstream providers.
- Hunt packet loss: persistent loss suggests failing hardware, overloaded links, or duplex mismatches.
- Test endpoints: confirm CPU, memory, disk, and encryption overhead aren’t limiting throughput.
- Review NAT and port forwarding: for hosted or peer-to-peer apps, incorrect NAT rules can break flows and increase retries/timeouts.
If you need ongoing visibility, Netalith can monitor RTT, jitter, packet loss, and throughput trends to surface recurring bottlenecks and validate whether changes improve user experience.
Practical examples and short case studies
- Fast speed test, laggy calls: bandwidth and throughput look fine, but high jitter/packet loss causes VoIP dropouts—focus on Wi‑Fi quality, QoS, and loss sources.
- Slow file copy to cloud VM: modest packet loss plus higher RTT limits single-flow TCP throughput—use iperf3, consider parallel transfers, and investigate the lossy hop.
- Office feels slow at peak time: shared link saturation reduces throughput—apply QoS and schedule backups; consider upgrading bandwidth if utilization is consistently high.
Conclusion — Clear next steps for bandwidth vs latency vs throughput
network speed metrics is the simplest framework for diagnosing network slowdowns: bandwidth is capacity, latency/RTT and jitter determine responsiveness, and throughput reflects real delivery rates. Measure each metric, relate it to application sensitivity, and use targeted tests (ping, traceroute, iperf3, speed tests) for faster bottleneck identification and more confident fixes.
FAQs
What is jitter in networking, and what’s a “good” level?
Jitter is the variation in latency over time. For real-time voice/video, lower is better; noticeable jitter often indicates congestion, Wi‑Fi interference, or queueing on a saturated link.
How do I measure latency accurately?
Use ping for RTT and packet loss, and traceroute/tracert to see where delay increases. For deeper analysis, measure at multiple times and compare averages and spikes.
Can throughput be higher than bandwidth?
No. Throughput is constrained by the lowest-capacity segment and end-to-end conditions; it can approach bandwidth but not exceed the true bottleneck capacity.
Is packet loss or latency worse?
Both hurt, but packet loss often causes compounding effects: retransmissions reduce throughput and increase effective latency. For real-time traffic, even small loss combined with jitter can be disruptive. In summary, a strong bandwidth vs latency vs throughput strategy should stay useful long after publication.