How to Use Zenmap Topology View — Visual Network Mapping Tutorial 2026
How to use Zenmap topology view to visualize networks, run traceroute scans, and inspect hosts — step-by-step Zenmap tutorial (2026).
Drake Nguyen
Founder · System Architect
Why use the Zenmap topology view
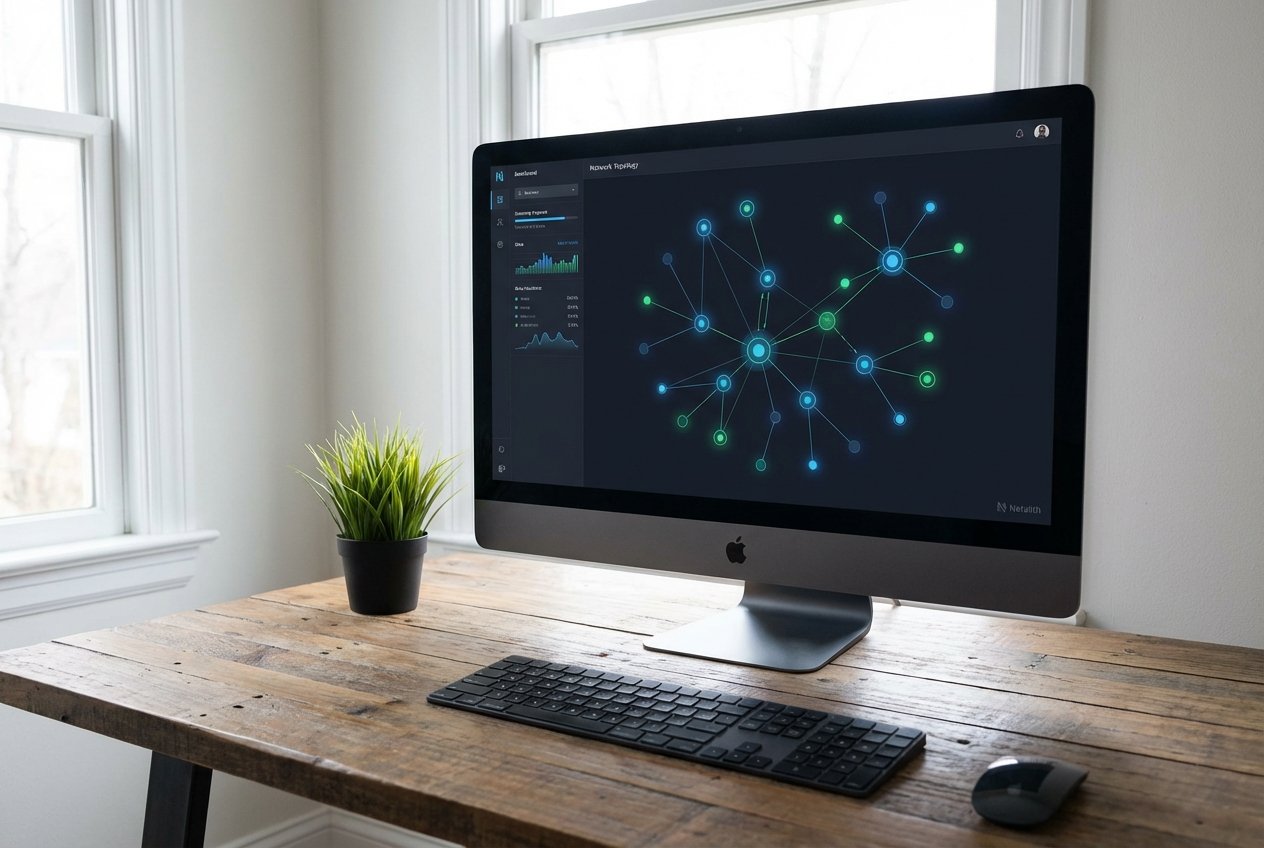
The Zenmap topology view turns traceroute-enabled Nmap scans into a visual network map so you can quickly see relationships between hosts, routers, and subnets. If you wonder how to use Zenmap topology view effectively, start by remembering it appears only for scans that collect hop data (for example, runs with --traceroute). The visual approach helps you triage issues faster than reading raw Nmap output: you can spot central gateway devices, isolated hosts, and unexpected paths at a glance.
Benefits include faster troubleshooting, easier communication with non-technical stakeholders, and the ability to prioritize follow-ups based on visual cues (for example, a host behind an unexpected router). Manage expectations: topology maps can be incomplete on filtered networks where ICMP/UDP/TCP probe replies are blocked, and some intermediate devices intentionally drop traceroute probes.
Install Zenmap (2026): quick checklist
- Download Zenmap and Nmap from the official Nmap project site or use trusted package managers (avoid third-party binaries).
- Install and keep packet-capture dependencies current: Npcap on Windows, libpcap on Linux/macOS.
- Run scans that require packet capture with elevated privileges (Administrator or sudo) for accurate traceroute and other privileged probes.
- Prefer the bundled or recent versions of Nmap + Zenmap so traceroute support and GUI stability are up to date.
Windows (installer + Npcap)
Download the official installer from nmap.org and run it as Administrator. During installation, install or update Npcap — the current Npcap release is required for accurate packet capture. If you must support legacy tools, select the "WinPcap API-compatible mode" option; otherwise use the default Npcap settings. After installation, launch Zenmap and run a simple scan (for example, 127.0.0.1) to verify it starts and the command preview reflects the expected Nmap command.
Linux (package manager, flatpak, or build)
Use your distro package manager (apt, dnf, pacman) where available, but package names can vary: some distros ship zenmap, others split it or provide a different package name. If distro packages are out of date, use Flatpak or build Zenmap from source to get recent GUI fixes. Confirm libpcap and Nmap versions meet the requirements for traceroute. When performing privileged scans, run Zenmap from a user with sudo rights or start the GUI with appropriate privileges according to your distro guidance.
macOS (dmg or Homebrew)
Install via the official .dmg or use Homebrew cask if one is available for your macOS version. Recent macOS releases may require granting packet capture or terminal permissions in System Preferences — approve prompts for network monitoring or terminal access as needed. Test by running a non-privileged scan first, then escalate to sudo for traceroute/enriched scans when required.
Zenmap GUI overview
Zenmap wraps Nmap with a GUI that exposes the main elements you need for topology mapping:
- Target / Profile input: where you enter hosts and choose or create scan profiles.
- Command preview: shows the exact Nmap command Zenmap will run (useful for learning the equivalent CLI options).
- Nmap Output: live textual output while the scan runs.
- Ports / Hosts: tabular view of discovered hosts and open ports.
- Topology: the visual map created from traceroute data.
- Host Details: detailed information on a selected node (services, OS guesses, ports).
- Scans Comparison: compare results from two saved scans to spot changes.
Profiles are just saved sets of flags — the command preview shows exactly how Zenmap calls Nmap. Traceroute-related responses appear in the Nmap Output and enrich the Host Details; once traceroute data is present, switch to the Topology tab to view the visual map.
Topology tab: what you'll see
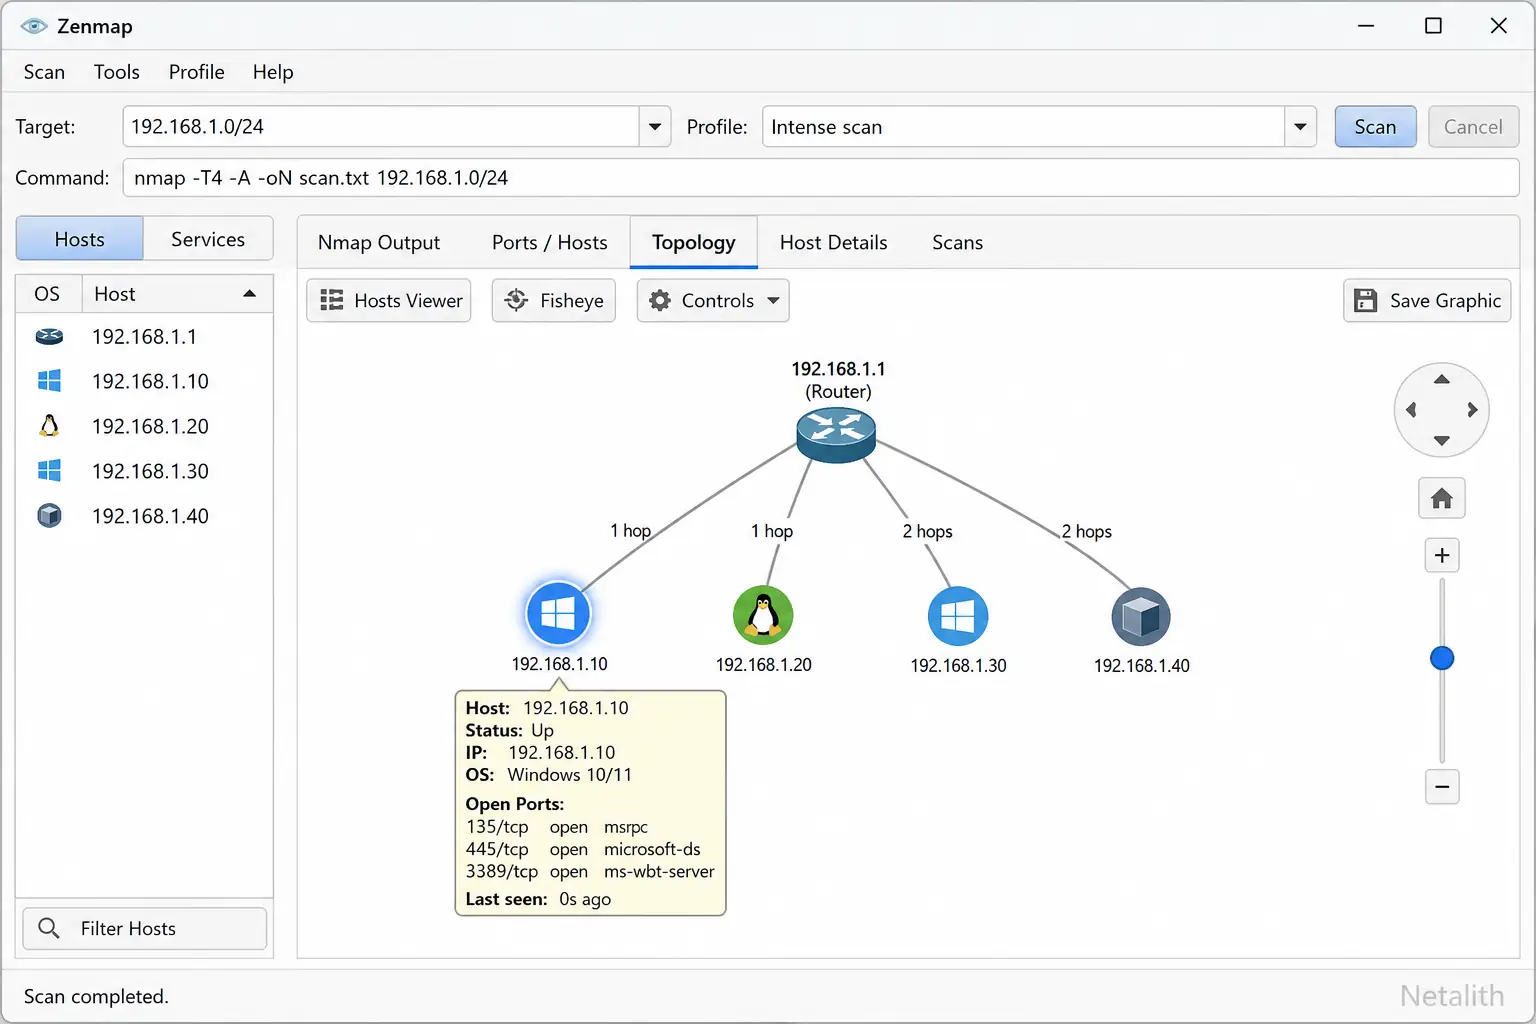
The Topology tab draws a graph where nodes represent hosts, routers, or labeled IPs and edges represent traceroute hops connecting them. Visual cues you’ll commonly find:
- Node types: different icons or shapes indicate hosts versus intermediate routers; labels show IPs or DNS names when resolvable.
- Edges: lines between nodes reflect observed hop sequences; multiple paths indicate asymmetric routing or parallel routes.
- Colors / icons: live hosts and filtered hosts are often differentiated by color or icon state; open services may be annotated on nodes.
- Interactive behaviors: pan and zoom the canvas, hover to see quick info, and click a node to open Host Details for services, OS detection, and ports.
Use the search or filter box in the Topology tab to highlight nodes matching queries (for example, hosts with port 80 open or devices running Windows).
Run scans that produce topology data
To produce topology data you must collect hop information. The core option is --traceroute. Below is a quick reference table showing useful flags, why you might include them, and trade-offs to consider.
| Flag / Option | Purpose | Trade-offs / Notes |
|---|---|---|
--traceroute |
Collect hop-by-hop traceroute data for topology construction | May be blocked by intermediate devices; increases scan time |
-A |
OS and version detection, script scanning to enrich host info | More intrusive and slower; higher chance to trigger IDS/IPS |
-v |
Increase verbosity to watch traceroute replies as they arrive | Helpful for troubleshooting but noisy for large runs |
-Pn |
Skip host discovery (treat all hosts as up) | Can increase completeness in filtered networks but may slow the scan |
Run the scan: example command
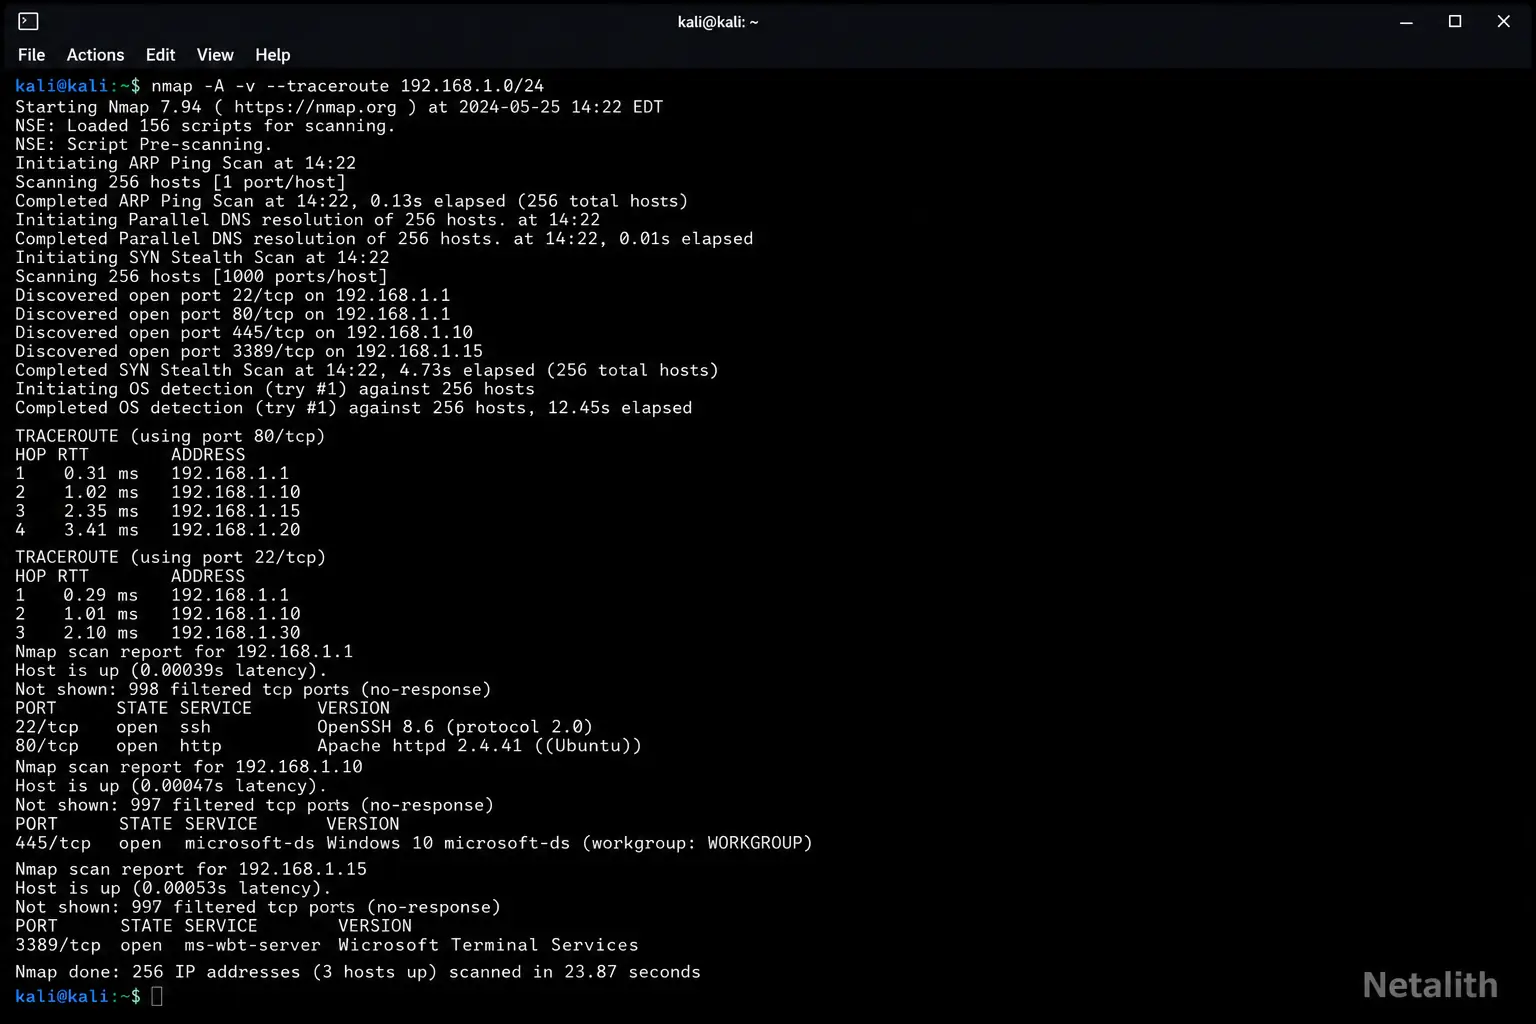
Example command you can copy into Zenmap's command preview or run from the terminal (replace the target with an authorized IP or subnet):
nmap -A -v --traceroute 192.168.1.0/24
What each part does:
-A: enables OS, version detection and some NSE scripts to enrich host nodes.-v: increases verbosity so traceroute replies are visible in Nmap Output.--traceroute: captures hop-by-hop data used to build the Topology view.
Advice: always run this against small, authorized subnets first. Expect scan time to scale with network size and chosen flags. When the scan completes, open the Topology tab — hop and path data from traceroute will populate the visual graph.
Flags and what they do (quick reference)
| Flag | Meaning | Effect on Topology |
|---|---|---|
--traceroute |
Collects traceroute hops | Constructs edges between devices for the Topology view |
-A |
OS & service detection | Enriches node labels with OS/service details in Host Details |
-sS / -sT |
SYN scan (stealth) or TCP connect scan | May affect which intermediate devices respond to probes |
-Pn |
Skip ping discovery | Useful in filtered networks but can reduce topology completeness |
Interpreting the topology view
Reading a topology map efficiently helps you prioritize follow-ups. Look for central nodes with many connections — these are likely routers, gateways, or aggregation devices. Isolated hosts connected through unusual paths can indicate misconfiguration, different VLANs, or routing anomalies.
Click nodes to open Host Details and combine the visual layout with service/version information to prioritize which devices require investigation. If you see gaps in the path (missing hops), consider that some devices may drop traceroute probes intentionally; verify with alternate flags or targeted traceroute from an endpoint if you have access.
Using filters and search in the Topology tab
Filters let you highlight nodes on the canvas using simple query syntax. Practical examples:
os:windows— highlights hosts where OS detection indicates Windows.port:80orservice:http— shows nodes with HTTP services.state:open— highlights hosts with one or more open ports.- Combine filters:
os:linux and port:22— narrows the map to Linux hosts with SSH open.
After filtering, Zenmap highlights matching nodes; you can export filtered host lists or take screenshots for reporting. Some Zenmap versions allow saving filters as part of a profile or copy-pasting the filter string into notes to reuse later.
Advanced visualization techniques
To make topology mapping repeatable and shareable, create and save custom scan profiles that include --traceroute and enrichment flags. Save scans in XML so they can be reopened or processed by external tools for richer visualizations on large networks.
Use Zenmap's Compare Results feature to visually diff two scans and quickly spot added/removed devices or changes in open services.
Exporting, saving, and comparing topology maps
Practical steps and formats:
- Save scans in Nmap XML (
-oX) for archival and external processing; Zenmap can load saved XML to reconstruct the Topology view. - To compare two scans: save each scan as XML, open Zenmap's Compare Results tab, and load both files to view added/removed hosts and changed services visually.
- For very large networks, export the Nmap XML and convert it into formats supported by Graphviz or Gephi (many community scripts exist to translate Nmap XML into Graphviz DOT or CSV for import).
Step-by-step walkthrough: build a topology map
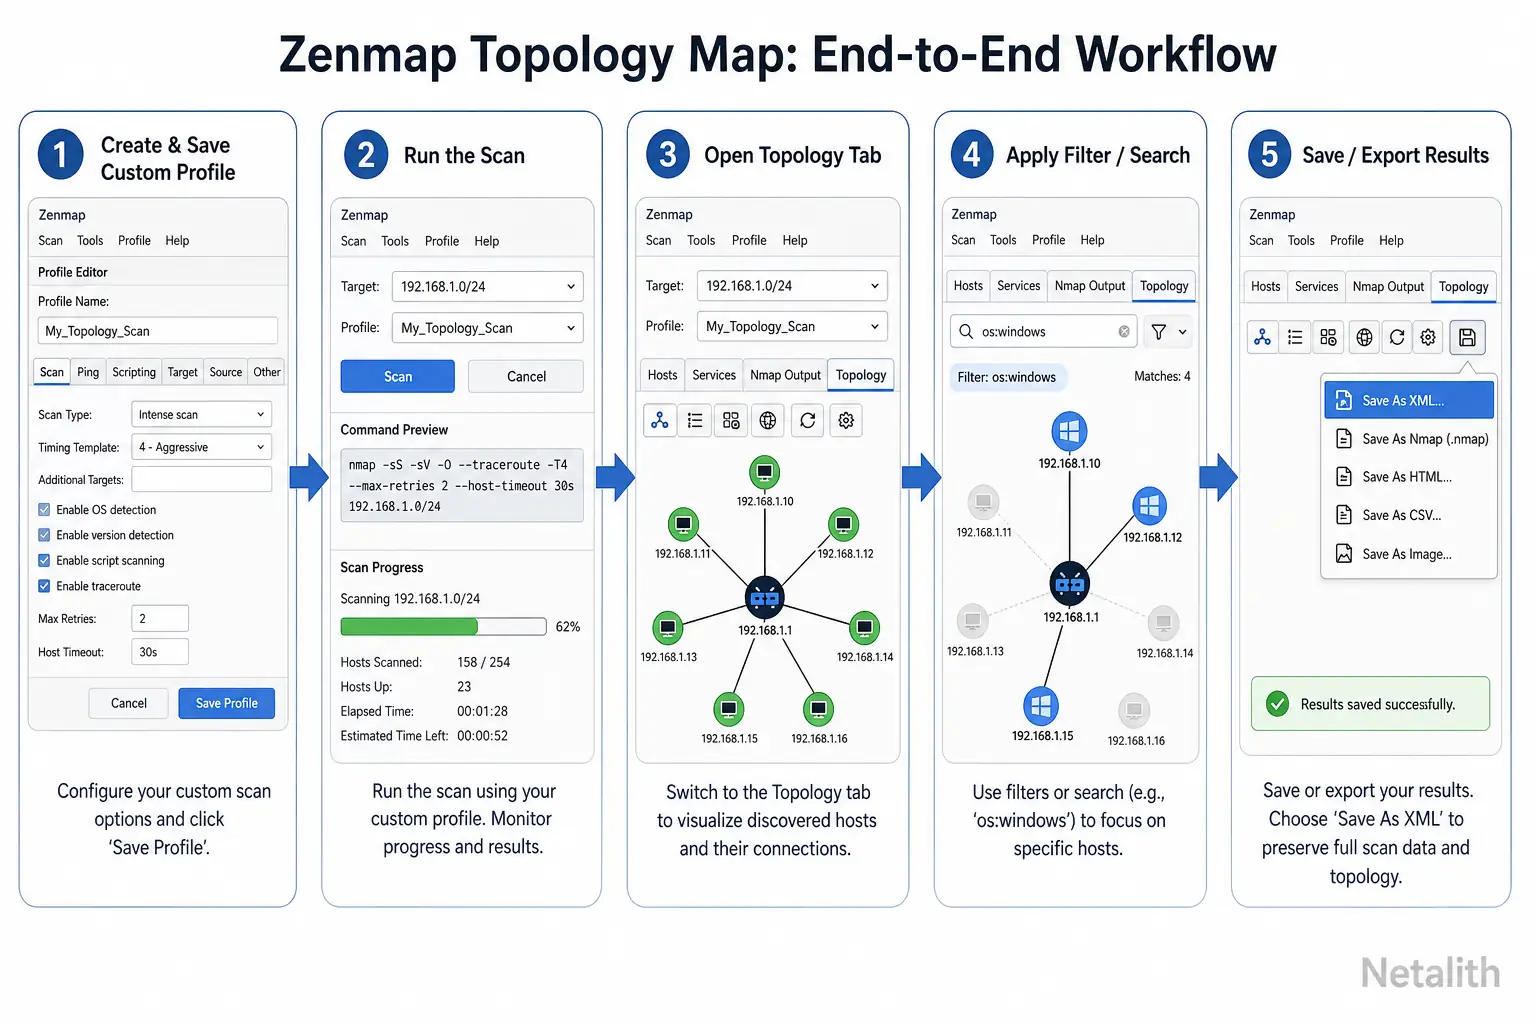
- Confirm authorization and scope — only scan networks you are allowed to test.
- Open Zenmap, enter the target (IP or subnet) and select or create a profile that includes
--traceroute(for example, add--traceroute -A -vto a custom profile). - Run the scan and monitor the Nmap Output for traceroute hop responses and possible errors (timeouts or dropped probes).
- Switch to the Topology tab when the scan finishes. Pan and zoom the map, click nodes to view Host Details, and apply filters to highlight the assets you care about (for example,
port:22). - Save the scan as XML for records and export filtered host lists or screenshots for reporting.
Troubleshooting & best practices
Common problems and fixes:
- No topology shown: verify the scan included
--tracerouteand check Nmap Output for traceroute responses. If traceroute probes are dropped, try alternate scan flags or run the scan from a different network vantage point. - Permission issues: ensure Npcap/libpcap is installed and updated, and that you ran Zenmap with the privileges required for privileged probes.
- Large networks slow or freeze the GUI: target subnets, increase timeouts rather than scanning the entire address space at once, or export XML for offline processing with specialized graph tools.
Conclusion and next steps
Recap: to get useful visual maps know how to use Zenmap topology view — run traceroute-enabled scans, enrich results with detection flags, and apply filters to focus on assets of interest. Next steps: create reusable profiles that include --traceroute, schedule scans where authorized, and archive Nmap XML to integrate with external visualization tools for larger datasets. Always scan only authorized targets and follow your organization's policies.
Further reading & resources
- Nmap official documentation: reference for
--tracerouteand scan options (consult nmap.org for the latest docs). - Npcap / libpcap installation guides: vendor documentation for platform-specific packet capture setup.
- External visualization tools: Graphviz and Gephi community scripts for converting Nmap XML into richer network graphs for large-scale analysis.