Intermittent Cloudflare 522 error: 3 weeks to prove it was my host, not my server
An intermittent Cloudflare 522 error took 3 weeks to resolve. The proxy on/off test, the origin evidence to collect, and the host firewall block behind it.

Long Nguyen
Fullstack Developer · AI Engineer · Researcher
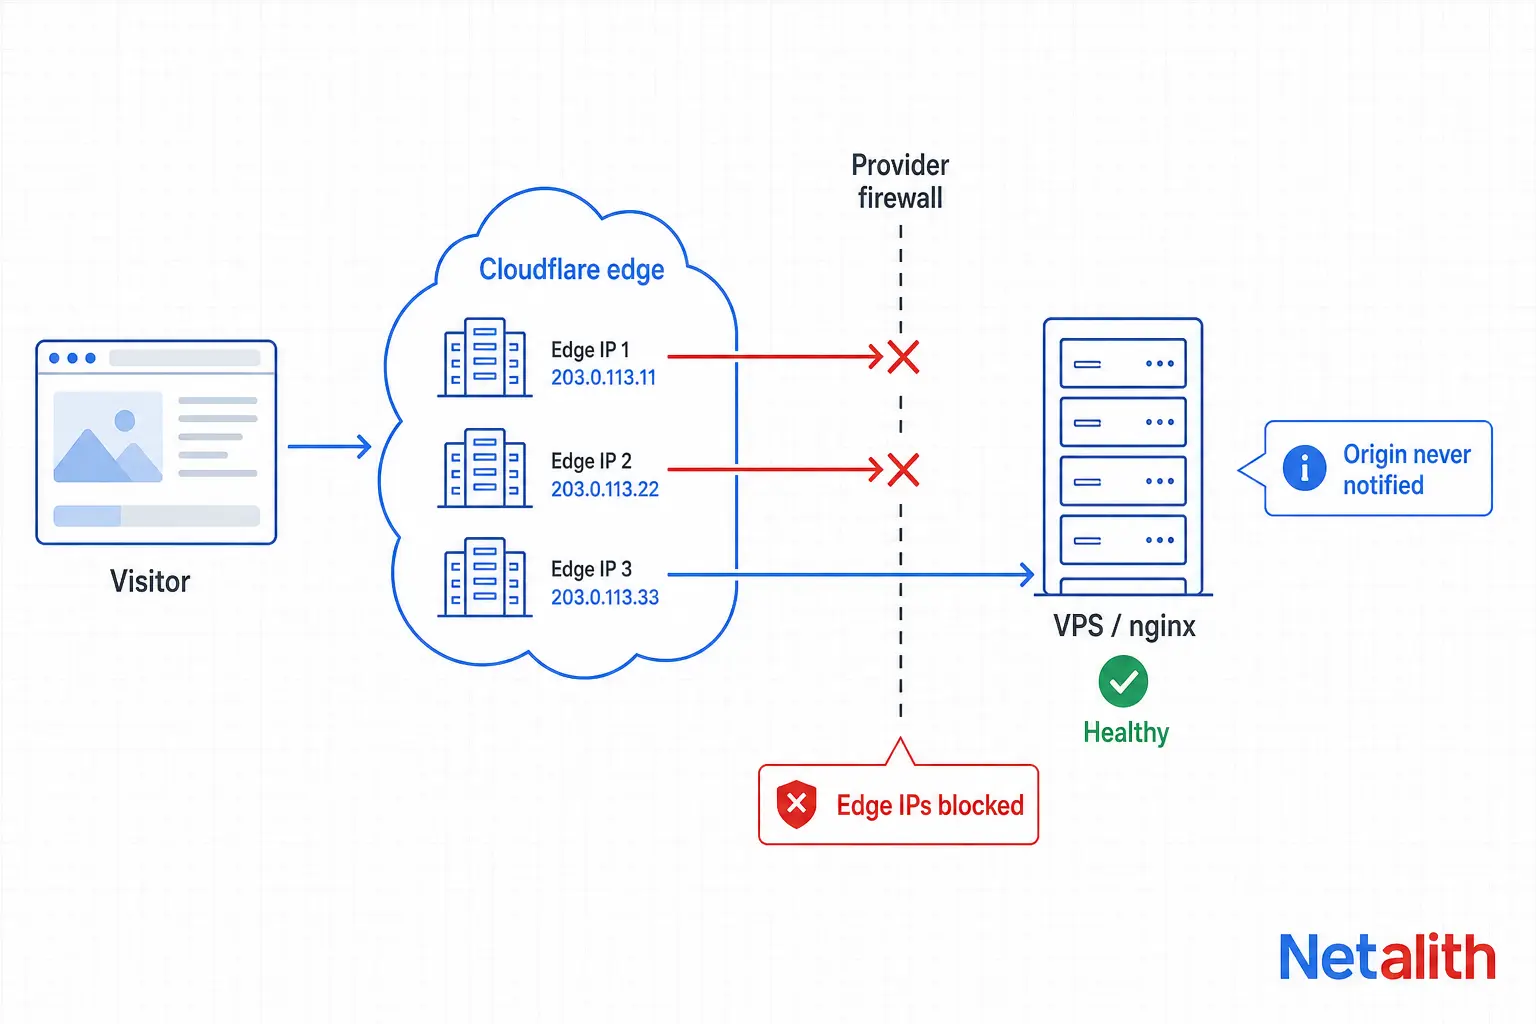
What a Cloudflare 522 actually means, and what it rules out
A 522 is written by Cloudflare's edge, not by your application. The edge opened a TCP connection toward your origin and gave up waiting. Your code never ran. Your browser, your router and your home Wi-Fi are not in that path at all.
Cloudflare's own documentation on error 522 is precise about the timers: before a connection is established, the origin must return a SYN+ACK within 19 seconds of the edge sending a SYN, with a retry backoff of 1,1,1,1,1,2,4,8; after the connection is up, the origin must acknowledge the resource request within 90 seconds. Miss either one and you get a 522. The same page names the most common cause outright — Cloudflare IPs being rate limited or blocked in .htaccess, iptables or a firewall. Keep that sentence in mind; it matters later.
The neighbouring codes are what turn a single error into a diagnosis, so read the whole set rather than the one on screen:
| Code | What the edge observed | What it points at |
|---|---|---|
| 520 | A response came back, but empty or malformed | Something answered and then failed to produce valid HTTP |
| 521 | The connection was actively refused (RST) | Service stopped, or a firewall rejecting rather than dropping |
| 522 | No SYN+ACK inside the window | Packets going into a black hole, or an origin too loaded to accept |
| 524 | TCP established, no HTTP response in time | Slow application, hung worker, database stall |
| 525 | TLS handshake with the origin failed | Certificate or protocol mismatch — or a handshake dying mid-flight |
| 499 | The visitor gave up before any response arrived | Usually collateral damage from the codes above |
The difference between 521 and 522 is the single most useful distinction here. A firewall that rejects sends a RST and you get a 521. A firewall that drops sends nothing, and the edge sits there until the timer expires — a 522. If you are getting 522s, something in the path is most likely discarding packets silently.
The proxy on/off test that splits the blame in under a minute
Before you argue with anyone, run the one test that isolates the variable. Set the DNS record to DNS only (grey cloud), wait out the TTL, and hit the site several times. Then switch it back to proxied (orange cloud) and hit it again from the same client, in the same minute, over the same connection.
My numbers on :
- Proxy off: 5 of 5 requests succeeded, sub-second.
- Proxy on: 1 of 8 requests succeeded.
Same server, same minute, same configuration, nothing changed on my side. That result is worth more than an hour of log reading, because of what it holds constant. With the proxy off, the connection reaching your origin comes from your client's IP. With the proxy on, it comes from a Cloudflare edge range. Everything else — your app, your nginx config, your DNS target, your certificate, your server load — is identical. If the success rate tracks the source IP range, you are looking at something filtering by source address. Not load. Not your code.
Two warnings, because this test has a cost. Grey-clouding publishes your origin IP in public DNS, so flip it back as soon as you have your numbers, and never run this while you are under attack. And respect the TTL — comparing a cached resolution against a fresh one gives you a meaningless result.
Proving the origin is healthy before you open a ticket
Support will assume it is your server until you make that assumption expensive to hold. Collect the evidence while the failures are happening, not afterwards — a healthy reading taken during a recovery window proves nothing. This is what I had:
| Check | Where | Result | What it eliminates |
|---|---|---|---|
| Local HTTP response | curl on the box itself |
HTTP 200 in 26 ms | Application, Gunicorn, nginx |
| nginx error log | /var/log/nginx/error.log |
Completely empty during the failures | Upstream errors, worker crashes |
| TLS from outside | openssl s_client, TLS 1.2 and 1.3 |
Both negotiate, certificate valid | 525-class certificate problems |
| Path toward the edge | MTR from origin to a Cloudflare IP | 0.0% loss, 1 ms | Outbound routing from the origin |
| Resources | free / df |
RAM 3 of 15 GB, disk 13% | Overload, OOM killer, full disk |
| Second site, same box | Different codebase entirely | Identical failure pattern | Anything application-specific |
| Edge analytics | Cloudflare dashboard | Every 5xx with originResponseStatus = 0 |
The entire application layer |
That last row is the one to lead with. originResponseStatus = 0 means Cloudflare recorded no HTTP status from the origin at all — not a 500, not a 502, nothing. There was no status line to record. Once every failed request shows that, no explanation involving your code survives.
One day of edge analytics looked like this: 520 sixteen times, 525 six times, 522 twice, 524 once, and 499 one hundred and sixty-eight times. The 499s are the part people miss. Those are real visitors closing the tab before anything came back — the visible 5xx count is the tip of the damage, not the measure of it.
The mixed signature is also informative. A clean, total block produces 522 and nothing else. A spread across 520, 522 and 525 says connections were dying at different stages of the handshake — consistent with something discarding a subset of packets, not with a rule cleanly refusing everything.
Why “check your firewall” is the wrong answer to an intermittent 522

I received the standard reply: whitelist the Cloudflare IP ranges in your firewall, and watch your VPS CPU and RAM. Two things are wrong with it as a response to this failure pattern.
Firewall rules do not flap. A rule blocking Cloudflare on my box would fail 100% of requests, deterministically, until I changed it. Mine failed roughly 85%, recovered on its own, then failed again days later while I touched nothing. Any explanation that requires a static rule has to account for the intermittency, and that one cannot.
“Your firewall” is not the only firewall. Cloudflare's docs are right that blocked Cloudflare IPs are the most common cause. But on a managed VPS there are at least three firewalls between an edge POP and your process: the provider's network and platform layer, the hypervisor or control-panel layer, and the guest OS. You administer exactly one of them. A support script that says “check your firewall” is pointing at the only layer that has already been ruled out, and away from the two that the customer cannot inspect.
There is a related trap worth naming. When my provider checked the VPS during the incident, they reported the firewall open and nginx healthy — and that was completely true. They had probed from their own network and landed on the 15% that succeeded. A successful probe during a partial drop is not evidence of anything. If you are asking a host to verify reachability, ask them to correlate against your Ray IDs and timestamps, or to test from a Cloudflare edge range. Testing from inside their own network answers a different question than the one you asked.
The root cause: the host's firewall was blocking Cloudflare edge IP ranges

On , after three weeks, I got the answer in writing. Their technical team identified a platform-wide incident affecting Cloudflare traffic: some Cloudflare edge IP ranges had been unintentionally blocked by their firewall, causing routed connections to fail with HTTP 522. The VPS itself, they confirmed, operated normally throughout. A fix had been deployed and the affected ranges removed from the blocklist.
That single sentence explains every anomaly I had been staring at for three weeks:
- The intermittency. Only a subset of edge ranges was blocked. Which Cloudflare IP fronts any given request varies, so a request landing on a blocked range failed and one landing on a clean range sailed through. An 85% failure rate is exactly what a partial range block looks like from the outside.
- The self-healing. It never healed. Edge IP assignment shifted, my traffic moved onto unblocked ranges for a while, and the symptom went quiet with the cause untouched. This is why “it seems to be resolved” is not a diagnosis.
- The contradiction. “Your VPS is fine” and “Cloudflare cannot reach your VPS” were both true at the same time. The block sat upstream of the machine, on infrastructure I had no visibility into.
- The standoff. Cloudflare said the fault was not on their edge. They were right. The host said the VPS was healthy. They were right too. Both parties answered honestly about their own layer, and the failure lived in the seam between them.
- The second site. A different codebase on the same box failed identically, because the filter operated on IP addresses and had no idea what was running behind them.
The practical lesson is a question you should ask early and explicitly: is there an open platform-level incident affecting Cloudflare traffic? That is a different question from “is my VPS up?”, it gets routed to a different team, and it is the one that got me an answer. This was never an account-specific problem. Other customers were hitting it at the same time and, as far as I can tell, most of them never found out why.
If you run your own edge firewall, keep the allowlist sourced from Cloudflare's published IP ranges and refresh it automatically rather than pasting the list once and forgetting it. Ranges change, and a stale allowlist decays into exactly the failure described here.
How I got the host to actually investigate: three weeks, three channels
| Date | What I did | What came back |
|---|---|---|
| 25–26 Aug | Reported to Cloudflare with edge analytics, Ray IDs, MTR, the proxy on/off numbers | Not their edge. Free plan, so no ticket could be opened |
| 26 Aug | Contacted the host | No response. Errors stopped on their own |
| 5 Sep | Contacted again: chat agent, then human support | A generic “check your firewall” guide. No ticket ID issued |
| 6 Sep | Public post on X with the full dated timeline and evidence, plus a one-star review | — |
| 7 Sep | — | Public reply: ticket raised with their dedicated team |
| 9 Sep | — | Email confirming the platform-wide incident and the deployed fix |
Here is the uncomfortable part, and I am not going to dress it up: no new technical evidence moved this. I had the same Ray IDs, the same logs and the same proxy differential on 5 September as I did on 9 September. What changed was the channel. The report that went nowhere in a private chat window got a named team on it within 24 hours of being public.
If you end up in the same position, a few things make a public escalation work rather than just make noise:
- Lead with artefacts, not adjectives. Exact UTC timestamps, Ray IDs including the colo suffix (mine ended in
-SIN), the proxy on/off numbers, and the fact that a second unrelated site on the same box failed identically. - State what you are asking for. I asked for a root cause and named the three things I wanted checked: host node status, network routing for the VPS, and anything dropping connections to my origin IP. A vague complaint gets a checklist; a specific ask gets routed.
- Stay factual and unemotional in public. Anger gives them a reason to treat you as a difficult customer. A dated timeline with Ray IDs gives them nothing to dismiss.
- Leave out your own attack surface. Post the failure evidence, not your stack layout, internal paths or anything you would rather not have indexed.
- Demand a ticket ID before the chat closes. I was never given one, across multiple contacts. Without it there is no reference for the next conversation and no accountability chain — each contact starts from zero, which is precisely why three weeks passed.
What intermittent 522s cost you while you wait
A hard outage is loud and short. This kind is quiet and long, which makes it more expensive than it looks.
Search engines treat a 522 as a server error and back off crawling when they meet a run of them. Intermittent is worse than down: crawlers sample your site, so a portion of every crawl fails, and there is no clean incident window to point at afterwards. AI answer engines are harsher still, because many of them fetch pages live at answer time. A failed fetch during that window is a citation you simply do not get, and there is no retry queue that comes back for you later. When your reachability is degraded, your visibility is degraded — that path is part of your AI search visibility and agent-readiness surface, not a separate infrastructure concern.
Then there is the monitoring blind spot that let this run for three weeks. If your uptime checks hit the origin IP directly, they will report 100% availability while every real visitor gets an error page, because your monitor is not coming from a Cloudflare edge range and is not being filtered. Mine looked perfect. The site was not.
What I changed afterwards
- Two monitors per site, and an alert on the gap between them. One checks through Cloudflare, one checks the origin directly. Neither number matters much on its own; the divergence is the diagnosis, and it would have flagged this on day one instead of week three.
- Log
CF-Rayat the origin. When the edge cannot reach you there is no log line at all, so the absence of Ray IDs during a failure window becomes evidence in itself — and it lines up one-to-one with what support can see on their side. - Record the colo suffix. Failures concentrated in one datacenter code are a routing or filtering story, not a capacity story. That detail pointed at the right layer long before anyone confirmed it.
- Cloudflare Tunnel as the structural fix. With a tunnel the origin dials out, so there is no inbound path for an upstream firewall to block or for anyone to reach directly. It costs you a daemon and a dependency, and for a stack that keeps getting hit by inbound filtering it is worth both.
- Keep the receipts from hour one. Screenshots, Ray IDs, timestamps, command output. Three weeks later those were the entire case. Nobody would have reconstructed them from memory.
One stopgap I would deprioritise: asking for a new origin IP. It helps when your specific address is what is being filtered. Here the block was on the Cloudflare side of the conversation, so a new IP would have changed nothing.
The part I am still uncomfortable about
Credit where it is due. They investigated, found it, fixed it, and put the cause in writing. Plenty of providers never send an email that says our firewall did this. That email is the reason this article can be specific instead of speculative.
But look at the detection path. A configuration change reached production infrastructure and started dropping a subset of Cloudflare edge ranges. It was not caught by internal monitoring. It was caught by a customer — and only surfaced after that customer escalated publicly. Every other affected customer during those weeks was being told to check their own firewall.
I will not claim an AI wrote the rule that broke this; I have no evidence for that and neither does anyone else. What I will claim is the shape of the problem. Infrastructure changes now ship faster than review and detection have adapted to handle, and the first layer between a correct bug report and an engineer who could act on it is increasingly an automated agent optimised to close conversations. Those two trends push in the same direction: defects reach production faster, and the signal from the people who notice them travels slower. In my case the bot closed the chat for inactivity and the follow-up email arrived with a generic checklist attached.
Being an engineer bought me nothing in that exchange. I gave them packet-level evidence and got a link about control-panel settings, because the script does not branch on whether the person reporting understands the system. And the escalation path that finally worked was reputational, not technical — which means the customers who get root causes are the ones who happen to have an audience. That is a bad equilibrium, and it is not unique to one provider.
So: keep your own evidence, monitor both sides of your own edge, and ask for a ticket ID every single time. If you are staring at intermittent 5xx errors right now and cannot tell whether the fault is your application, your host or the edge in front of it, I am happy to look at the evidence with you — book a free consultation and bring your Ray IDs.
FAQ
Frequently asked questions
What does Cloudflare error 522 actually mean?
It means Cloudflare's edge could not complete a TCP connection to your origin server in time. Per Cloudflare's documentation, the origin has 19 seconds to return a SYN+ACK after the edge sends a SYN, and 90 seconds to acknowledge the resource request once the connection is established. Your application code never runs, so a 522 is never an application bug.
Can a Cloudflare 522 be caused by my hosting provider rather than my own server?
Yes, and it is more common than the troubleshooting guides suggest. On a managed VPS there are at least three firewalls between a Cloudflare datacenter and your process: the provider's network layer, the hypervisor or panel layer, and the guest OS you administer. In my case the provider's own firewall had blocked a subset of Cloudflare edge IP ranges platform-wide, so the VPS was healthy and unreachable at the same time.
Why is my 522 error intermittent instead of constant?
Intermittency usually means only some of the Cloudflare edge IP ranges are affected. Which edge IP fronts any given request varies, so requests landing on a blocked range fail while others succeed. A static firewall rule on your own box would fail every request deterministically, so an intermittent 522 is strong evidence that the filter sits somewhere you do not control.
How do I prove to my host that the 522 is on their side?
Run the proxy on/off test and record the numbers, then collect origin-side evidence during the failure window: a local curl returning 200, an empty nginx error log, a clean MTR to a Cloudflare IP, normal RAM and disk, and Cloudflare edge analytics showing originResponseStatus = 0 on every 5xx. If a second site with a different codebase on the same server fails identically, include that too. Ask them to correlate against your Ray IDs rather than probing from their own network.
Does turning off the Cloudflare proxy fix a 522?
It makes the error disappear because traffic stops passing through the edge, but it does not fix anything and it publishes your origin IP. Use it as a diagnostic, compare the success rates with the proxy on and off within the same minute, then switch the proxy back on immediately.
Do intermittent 522 errors hurt SEO and AI search visibility?
Yes. Search engines treat 522 as a server error and reduce crawl rate when they hit a run of them, and intermittent failures are harder to recover from than a clean outage because there is no discrete incident window. AI answer engines that fetch pages live at answer time are affected more directly: a failed fetch is a missed citation with no retry.